What is Google Analytics and how does it work
What is not measured can not be improved. That is why it is essential that, in an environment in which everything leaves its mark, you use the appropriate analysis tools. This is where Google Analytics comes into play. It is the leading digital analytics tool that will help you make the best decisions at critical moments.
Google Analytics is a free Google service that was born in 2006 when it acquired Urchin. Since then, it is one of the leading professional platforms in measuring metrics.
What is Google Analytics?
The tool allows you to track websites, blogs, and social networks. In addition, it puts at your disposal predetermined and customizable reports. As indicated in its entry in Wikipedia, Analytics “offers grouped information of the traffic that arrives at the websites according to the audience, the acquisition, the behavior, and the conversions carried out on the website.” And also, Google Analytics is the dominant tool. It offers more data and metrics than any other.
It works on elements as varied and vital as the following:
- Number of visits
- Their duration
- Sources of traffic
- Visited pages
It also acts in sections such as:
- Your users preferred sections
- Keywords used
- Technical details of visitors’ devices. That would enter the browsers that users use or their mobile operating systems.
But what makes Analytics a complete tool is that it is compatible with the rest of Google’s tools. Thus, it is possible to combine Analytics with AdWords, Blogger or YouTube. In fact, all Google tools in which visits and traffic are counted can be mixed and complemented with Google Analytics. In addition, there are different attractive resources for Analytics available in Google Chrome. You can play with them too.
How do Google Analytics works: Processes
The analytics program can collect information from your site thanks to the JavaScript code that you must include in your pages and the cookies that are generated once the user accesses the web through a browser.
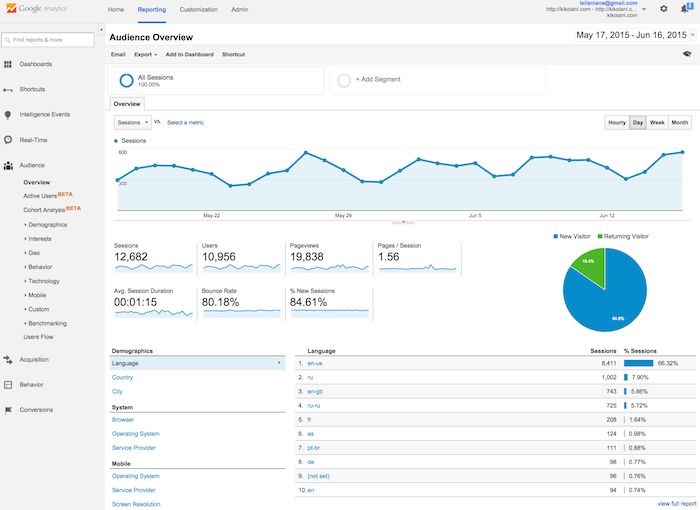
In this way, all Google Analytics records the activity of your user from the moment he arrives until he leaves your website and transforms it into different reports with graphs and statistical data to make it easier to know the evolution.
Its operation is based on three processes: the collection of data, the processing thereof and the creation of reports. However, to start with the process, as in any strategy you should set some objectives.
Also, although there are three important aspects, to offer you complete information, we will even talk about the configuration.
1.- Data Collection
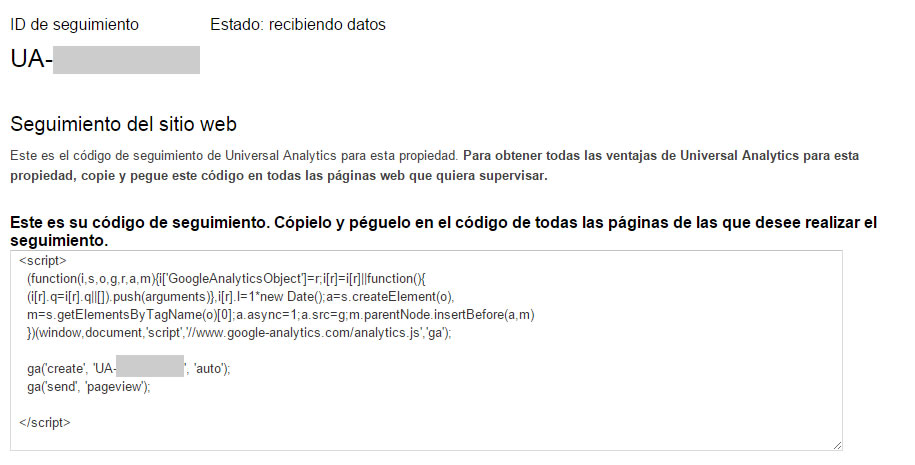
Google Analytics uses a JavaScript code to collect information from websites. In this way, Analytics records a visit each time a user views a page with the Google Analytics code. In the case of applications for mobile devices, it is necessary to add additional an code to each “activity” that you want to track.
In order to understand the data collection process we will explain it step by step:
- The server responds by sending the page that is requested to the user’s browser. In this way, once the browser analyzes the data, it will contact other servers that will deal with some parts of the code of that requested page. This is how the Google Analytics Tracking code works.
- Next, the user’s browser that visits your page asks that code to Analytics. The platform is sent and saved in a file called Urchin.js. While the code is being executed, the previously commented attributes of the visitor and his navigation are studied.
- Once all the data has been collected, the code creates cookies on the visitor’s computer.
- When the cookies are already defined, the code sends all that information to the Google Analytics server by requesting an invisible GIF file.
- Then save the data in another file called File Logs and create a section of data in it for each page viewed. These data include aspects such as the date and time, the search engine where the visitor comes from, the number of visits, etc.
2.- Data Processing
Once the interactions of a user have been collected, Google Analytics begins the data processing to transform the raw data into useful data that gives you knowledge. To process them, each of the data sections is analyzed separately. That is, their attributes are divided.
Google Analytics transforms each attribute into elements that it calls ‘fields’. In this way, for example, the IP address will become the “Visitor’s IP” field. Each section or line provides several attributes, and each of them is stored in different areas.
If you work with Google Analytics every day it is likely that you have faced the definition of the attribution model that helps you extract value from the data. It is very important that you define the model very well, in this way you will improve the results.
3.- Settings
Google Analytics applies its settings (for example, filters) to raw data. When the data has been processed, it is stored in a database. Once processed and inserted into the database, it is no longer possible to modify them.
This way you can control how this data appears in the Analytics profiles that you have created in your account.
4.- Report generation
The resulting reports can be consulted either from the Google Analytics web service itself, www.google.es/analytics or from other spaces for which it is necessary to use the reporting APIs.
Each report is created based on field comparisons. That is, aspects such as the visitor’s city or its conversion rate are taken into account.
Finally, once the data is stored in the database, the process is terminated.
How to set objectives with Google Analytics?
In Google Analytics you can configure many types of objectives. From the duration of the visit to your web page to much more specific information such as the number of pages visited, the number of visits or the number of users that have clicked on any of the elements shown on the page.
It is also interesting that the tool allows you to configure the objectives that you consider essential. Click on a specific item. However, you also have the option to use the targets that the tool automatically marks.
The 4 primary objectives in Google Analytics are:
- Destination: Define specific locations.
- Duration: Mark the length of a session.
- Pages/screens per session: It is the number of pages visited in the same session.
- Event: Activate an action that you have previously defined as an event.
7 attribution models in Google Analytics
The 7 attribution models that Google Analytics puts at your disposal are:
- Attribution of last interaction: In which 100% of the value of the conversion is attributed to the previous channel with which the client has interacted before making the conversion.
- Last indirect click: In this case, the total of the conversion value is attributed to the previous channel in which the customer has clicked before making the purchase.
- Last click of AdWords: Conversion is granted to the last ad in which the user clicked before making a conversion, regardless of whether or not he had previously clicked on other ads.
- First interaction: The conversion value is completely granted to the first channel with which the customer has interacted
- Linear attribution: Assigns the same credit to each channel interaction until the conversion occurs. Therefore, all points of contact have the same importance.
- Attribution of deterioration of time: A model that has a predetermined duration of 7 days. The point of contact that occurs seven days before the conversion receives half the value of the one that happens on the same day of the conversion. In addition, the value that takes place 14 days before gets a quarter of the attribution. And the action produced 30 days before receives the minimum attribution.
- Attribution according to the position: This is a hybrid model between the last interaction attribution model and that of the first interaction. Instead of attributing all the value to a single interaction, the one between the two is divided.
What are the most important metrics in Analytics?

Do you know how to get the most out of this tool? We are going to present the three most important and essential metrics in Analytics that will be fundamental to optimize your results.
1.- Average time on the page
It is a metric that calculates the time the user spends on your website. This time is average, that is, it refers to the common visitor.
Google Analytics offers you information about the average time spent on the website, but not for each user.
This information can help you uncover the importance of factors such as:
- The level of interest aroused in the reader.
- The average reading speed of the page.
- The level of engagement of your web page.
In addition, it is interesting to combine this data with the one referring to the relationship between the extension of the content and the time of permanence. If your content is extensive but the time of stay does not exceed the minute, something is happening.
The time of permanence is an essential data for some websites, especially those focused on putting value on their contents. However, for any web page, a longer stay time is always synonymous with success.
2.- References
Where do users come from? One of the best ways to know the origin of the readers of your website is to know what other websites link to yours.
Referrals, or references, are the indicators that will tell you what websites or sources your readers come from. This data is shown in a table that takes into account those traffic sources that provide you with traffic.
This table also shows the number of users coming from a website as well as the amount of traffic that comes from general sites. Organic traffic is also analyzed, which is the one that arrives either through SEO actions (search engine positioning) or by users who enter directly into your website.
The data of the referrals is essential. Knowing the sites that refer you and that feed you with traffic is a basic fact that will allow you to build bridges with them. Remember that one of the pillars to be able to position better in Google is to get valuable links to your website. For this, it is essential to have data such as references.
3.- Interests
One of the essential aspects of marketing is to find and identify users, people who may be interested in your offer. You can do this, among other ways, knowing your interests. For content marketing, it is essential to understand the interests and issues that move your customers.
If you want to connect with customers, it is necessary to have information about them. Google Analytics offers you this information through the keywords or concepts used in the search. The interests are the themes and words that make the clients come to you. What idea makes your website interesting?
The interest generated will give you an account of the type of user that enters your web page. In combination with other metrics, it will be possible to analyze the interests of the clients. Through these interests, you can better specify the keywords you use on your website. What will help you generate online marketing campaigns with more chances of success.
It is possible that you have a lot of traffic on your website but few conversions, you should then look at the conversion funnels that you have set in Google Analytics. This way you can know how your website works, the number of users that have arrived through different channels, which pages work best or in which pages you should start to make a radical change. In short, optimize the conversions of your websites. You can also use heat maps to measure it.
In short, Google Analytics measures traffic and how it is achieved. That is why it is one of the main tools we use in Antevenio Go! to extract information on which to build effective strategies. Do you want us to help you improve the capture of leads?